
Enabling insights with a performance analytics tool
Overview
Global satellite communications business Inmarsat is a leading provider of data connectivity to the maritime industry. As an airtime service provider for many global fleets, Inmarsat enables the lifeline of connectivity for thousands of vessels.
Elsewhen worked closely with Inmarsat to create a new customer-facing online analytics tool, providing real-time and historical data insights on the connectivity experienced by each vessel. Customers can now easily see and understand how factors such as location and weather conditions affect their connectivity.
Our services
- Item one
- Item two
- Item three
- Item four
- The brief
- How can fleet owners monitor their vessels to help provide better support?
Inmarsat works to both continuously improve the service they offer their maritime customers, and find new ways to provide new assurance that they are delivering what those customers demand. The scope of the project was twofold, covering both:
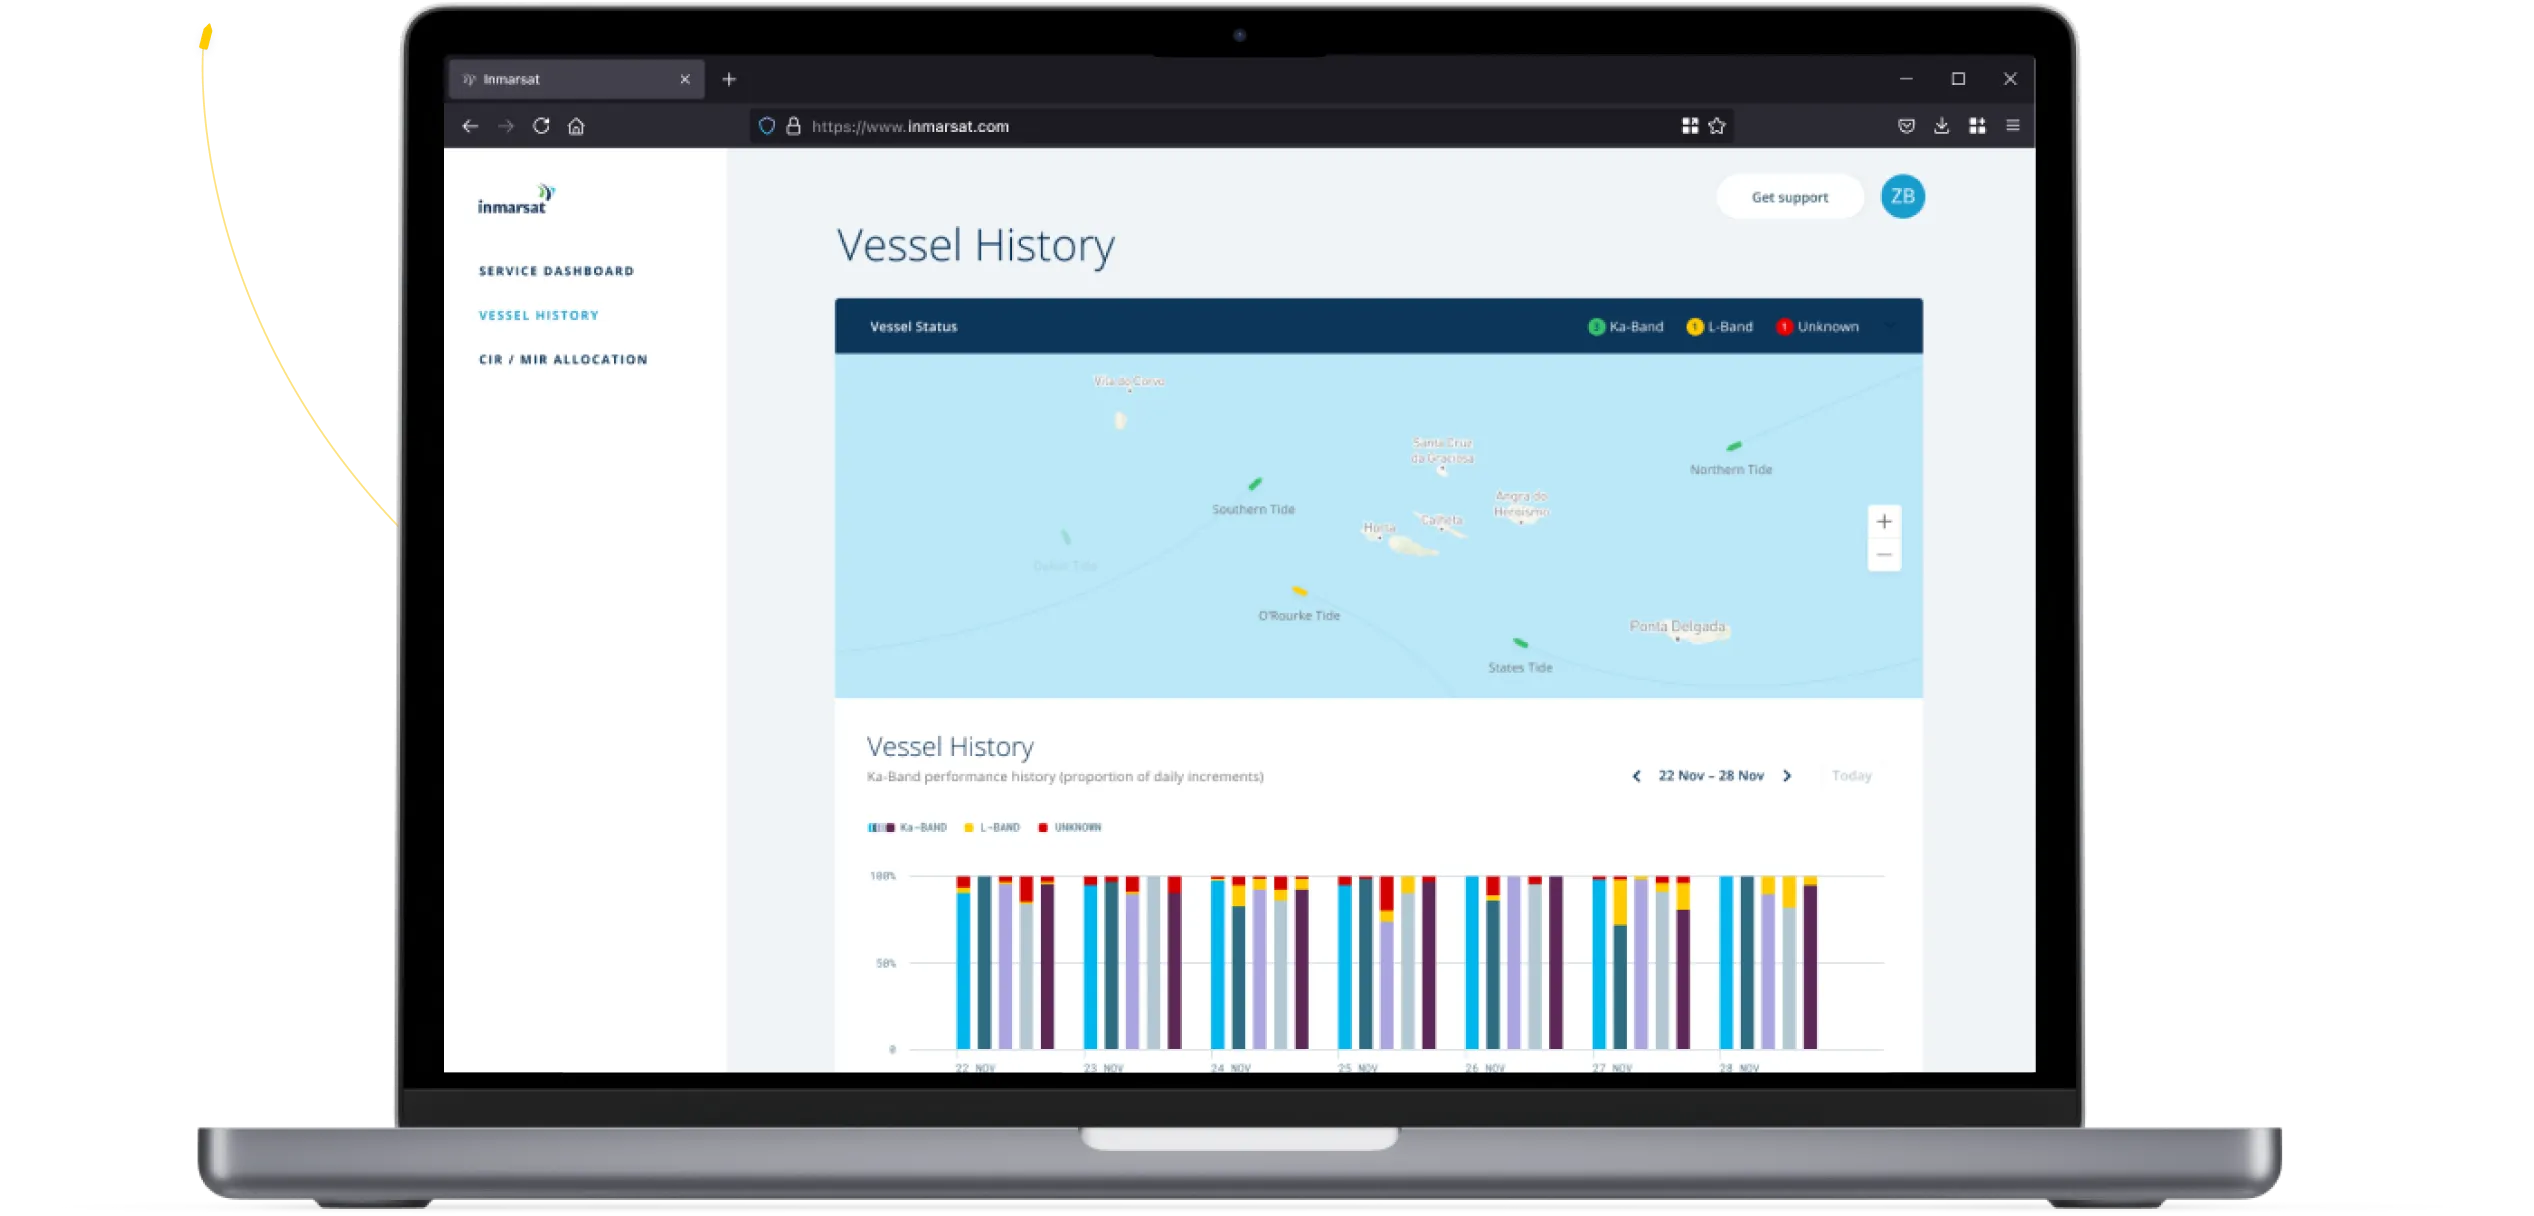
Providing Inmarsat’s customers with a deeper historic understanding of their vessels and/or signalling usage over a given period of time, that can be specified by the user
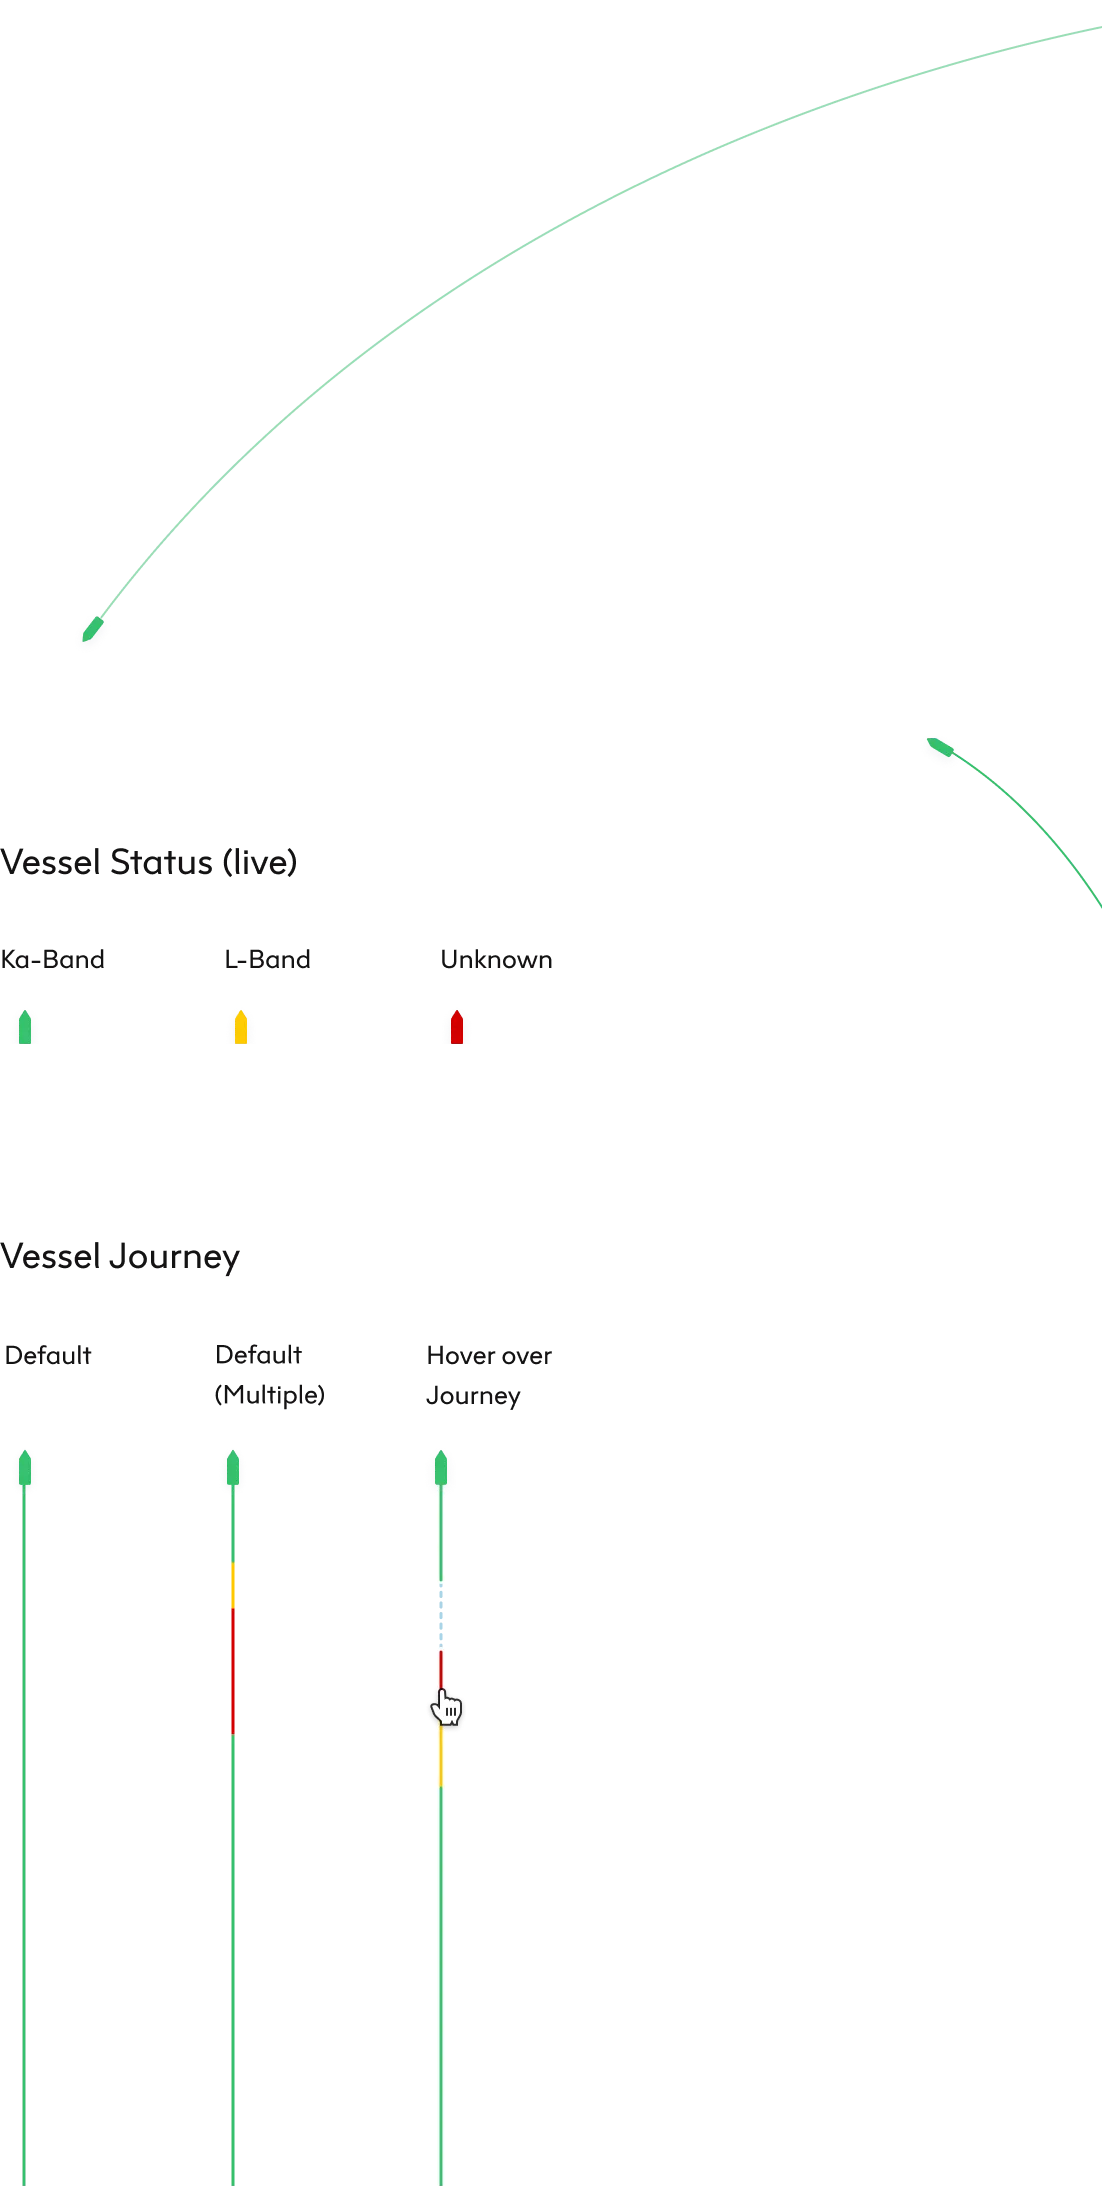
Providing a real-time visual representation of the geographical status and movement of a user’s vessel.
The project was perfect for us as it required us to work end-to-end to deliver the desired customer experience, combining engineering and design into a cohesive UX.
Our Services
- Rapid prototyping
- Roadmap definition
- UI & Interaction design
- Front-end engineering stack
- Customer experience
- The challenge
- Improve the UX in a technically complex environment
A core challenge was of course translating the raw coordinate information supplied by the endpoint into an elegant UI, as well as tangling with a not insignificant amount of sector-specific jargon - both maritime and relating to satellite connectivity. In addition, the data that needed to be piped in from the specific API endpoint was granular and non aggregated, meaning it would need to be cleaned before use.
While GXA Assurance was an entirely new product being purpose built for some of Inmarsat’s customers, the development environment was not greenfield. We would be working on the existing Inmarsat codebase - a genuinely complex environment in which to deliver a delightful customer experience.
There was a very tight turnaround on the project, with Inmarsat aiming to get the product into their customers’ hands as soon as possible.


- Our Strategic Approach
- Rapid delivery for Enterprise B2B
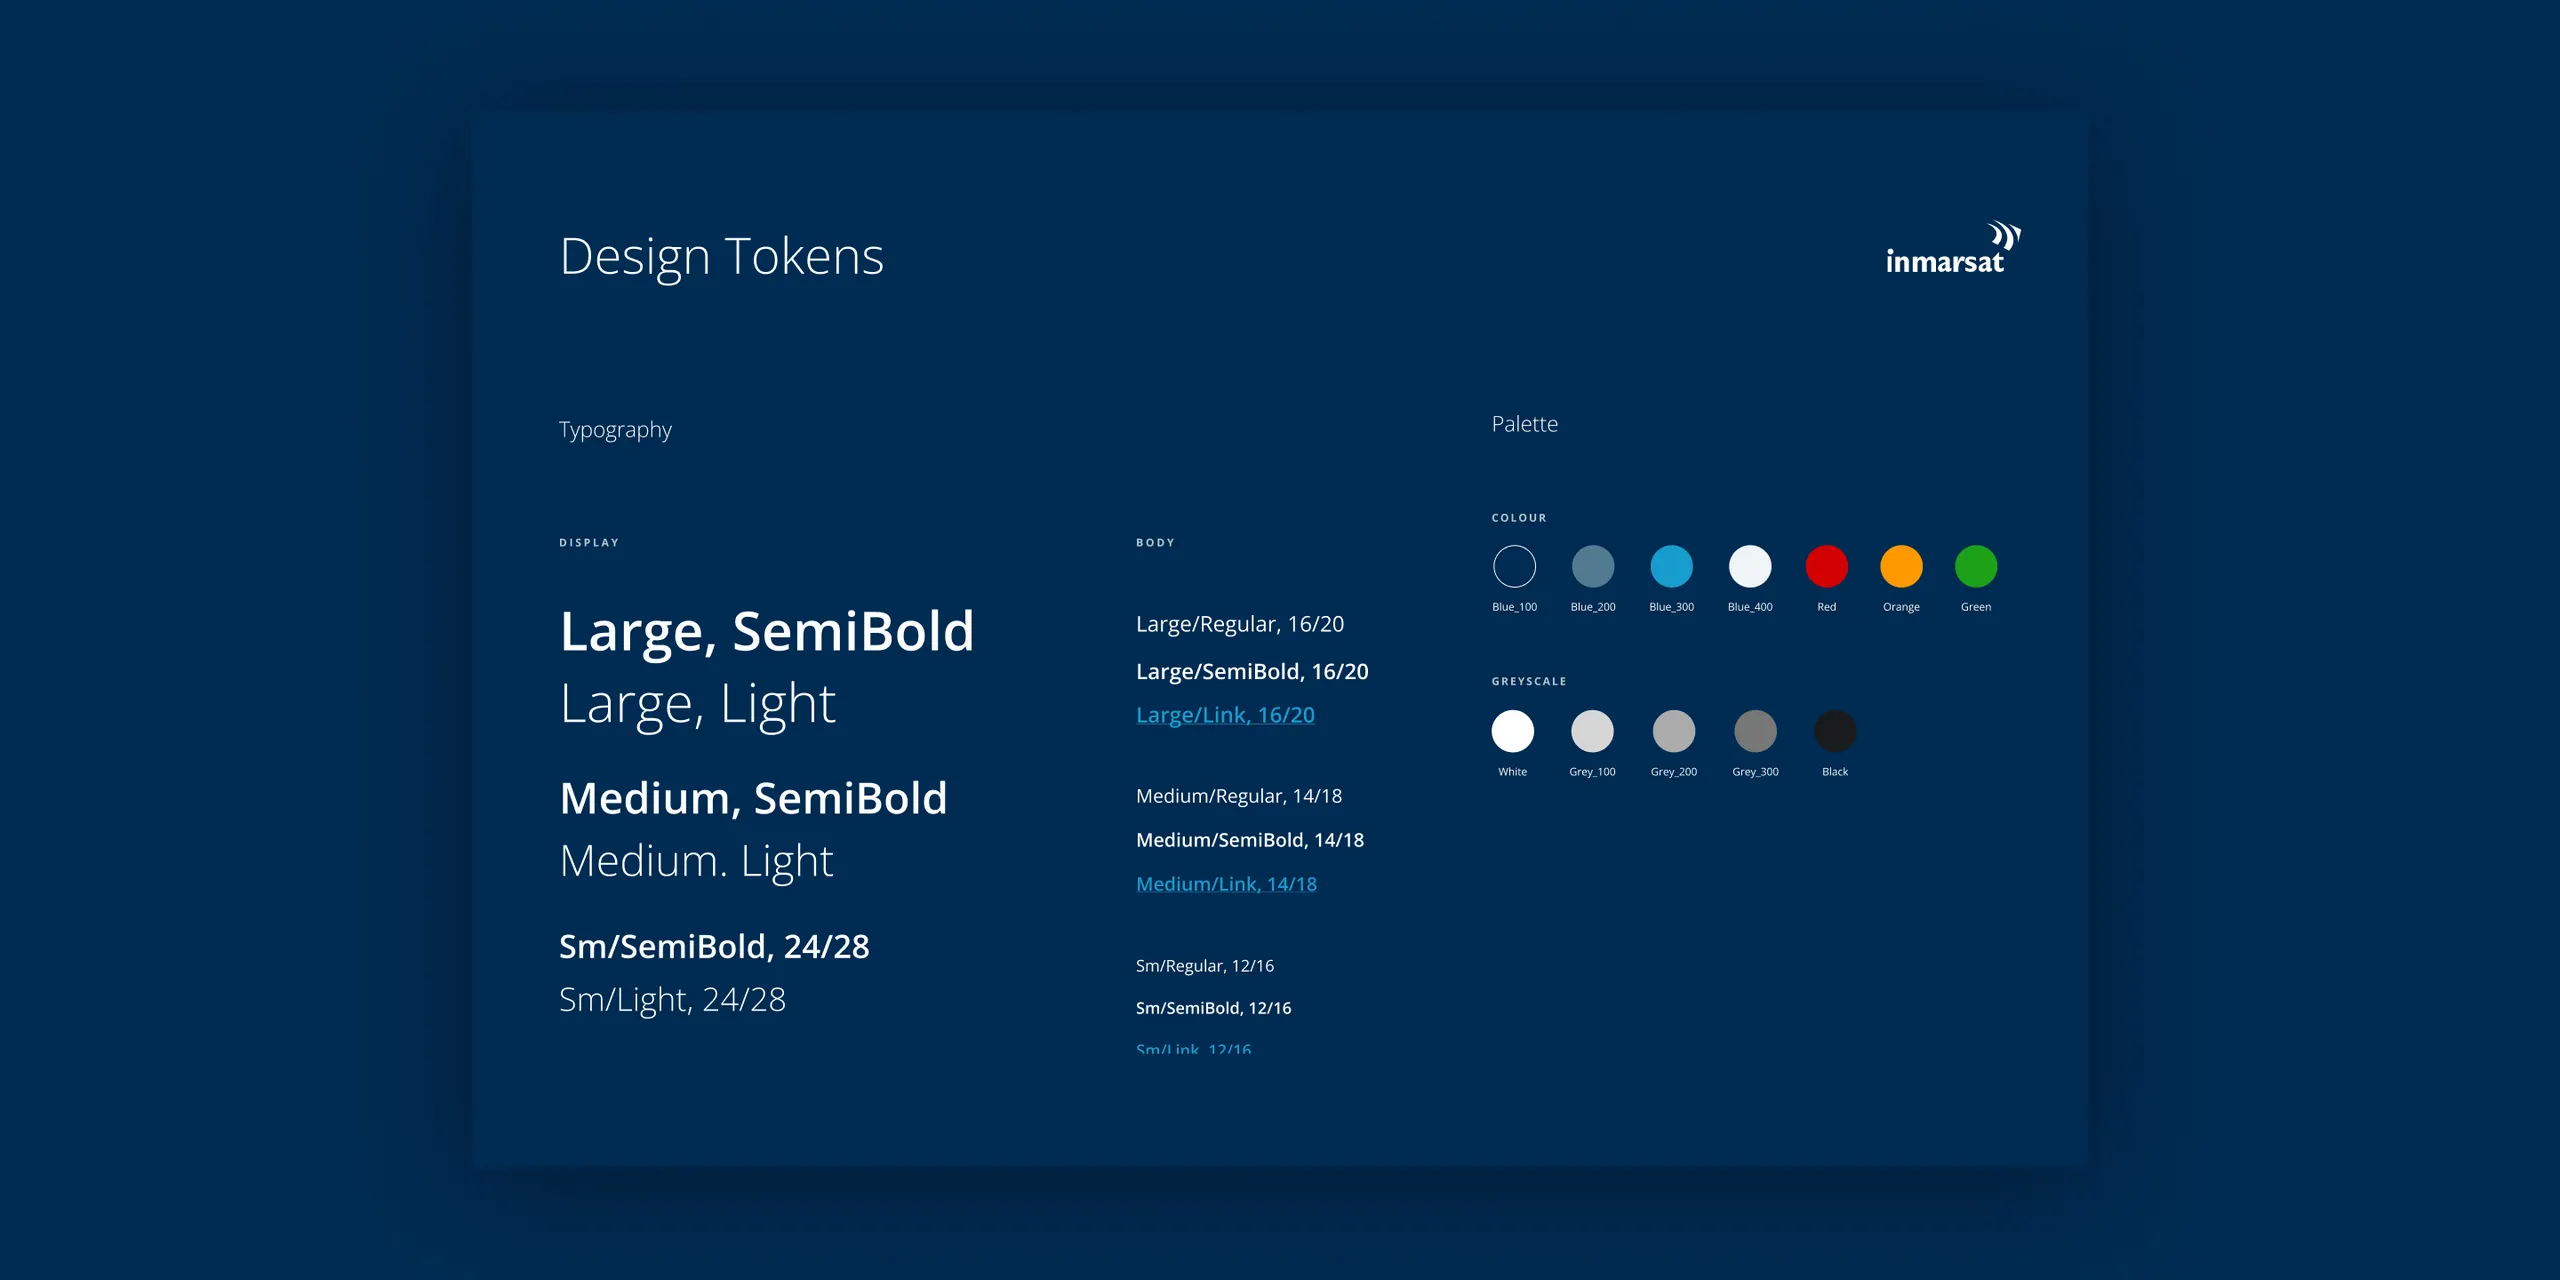
- Our design approach
- Visualise real-time and historical vessel data
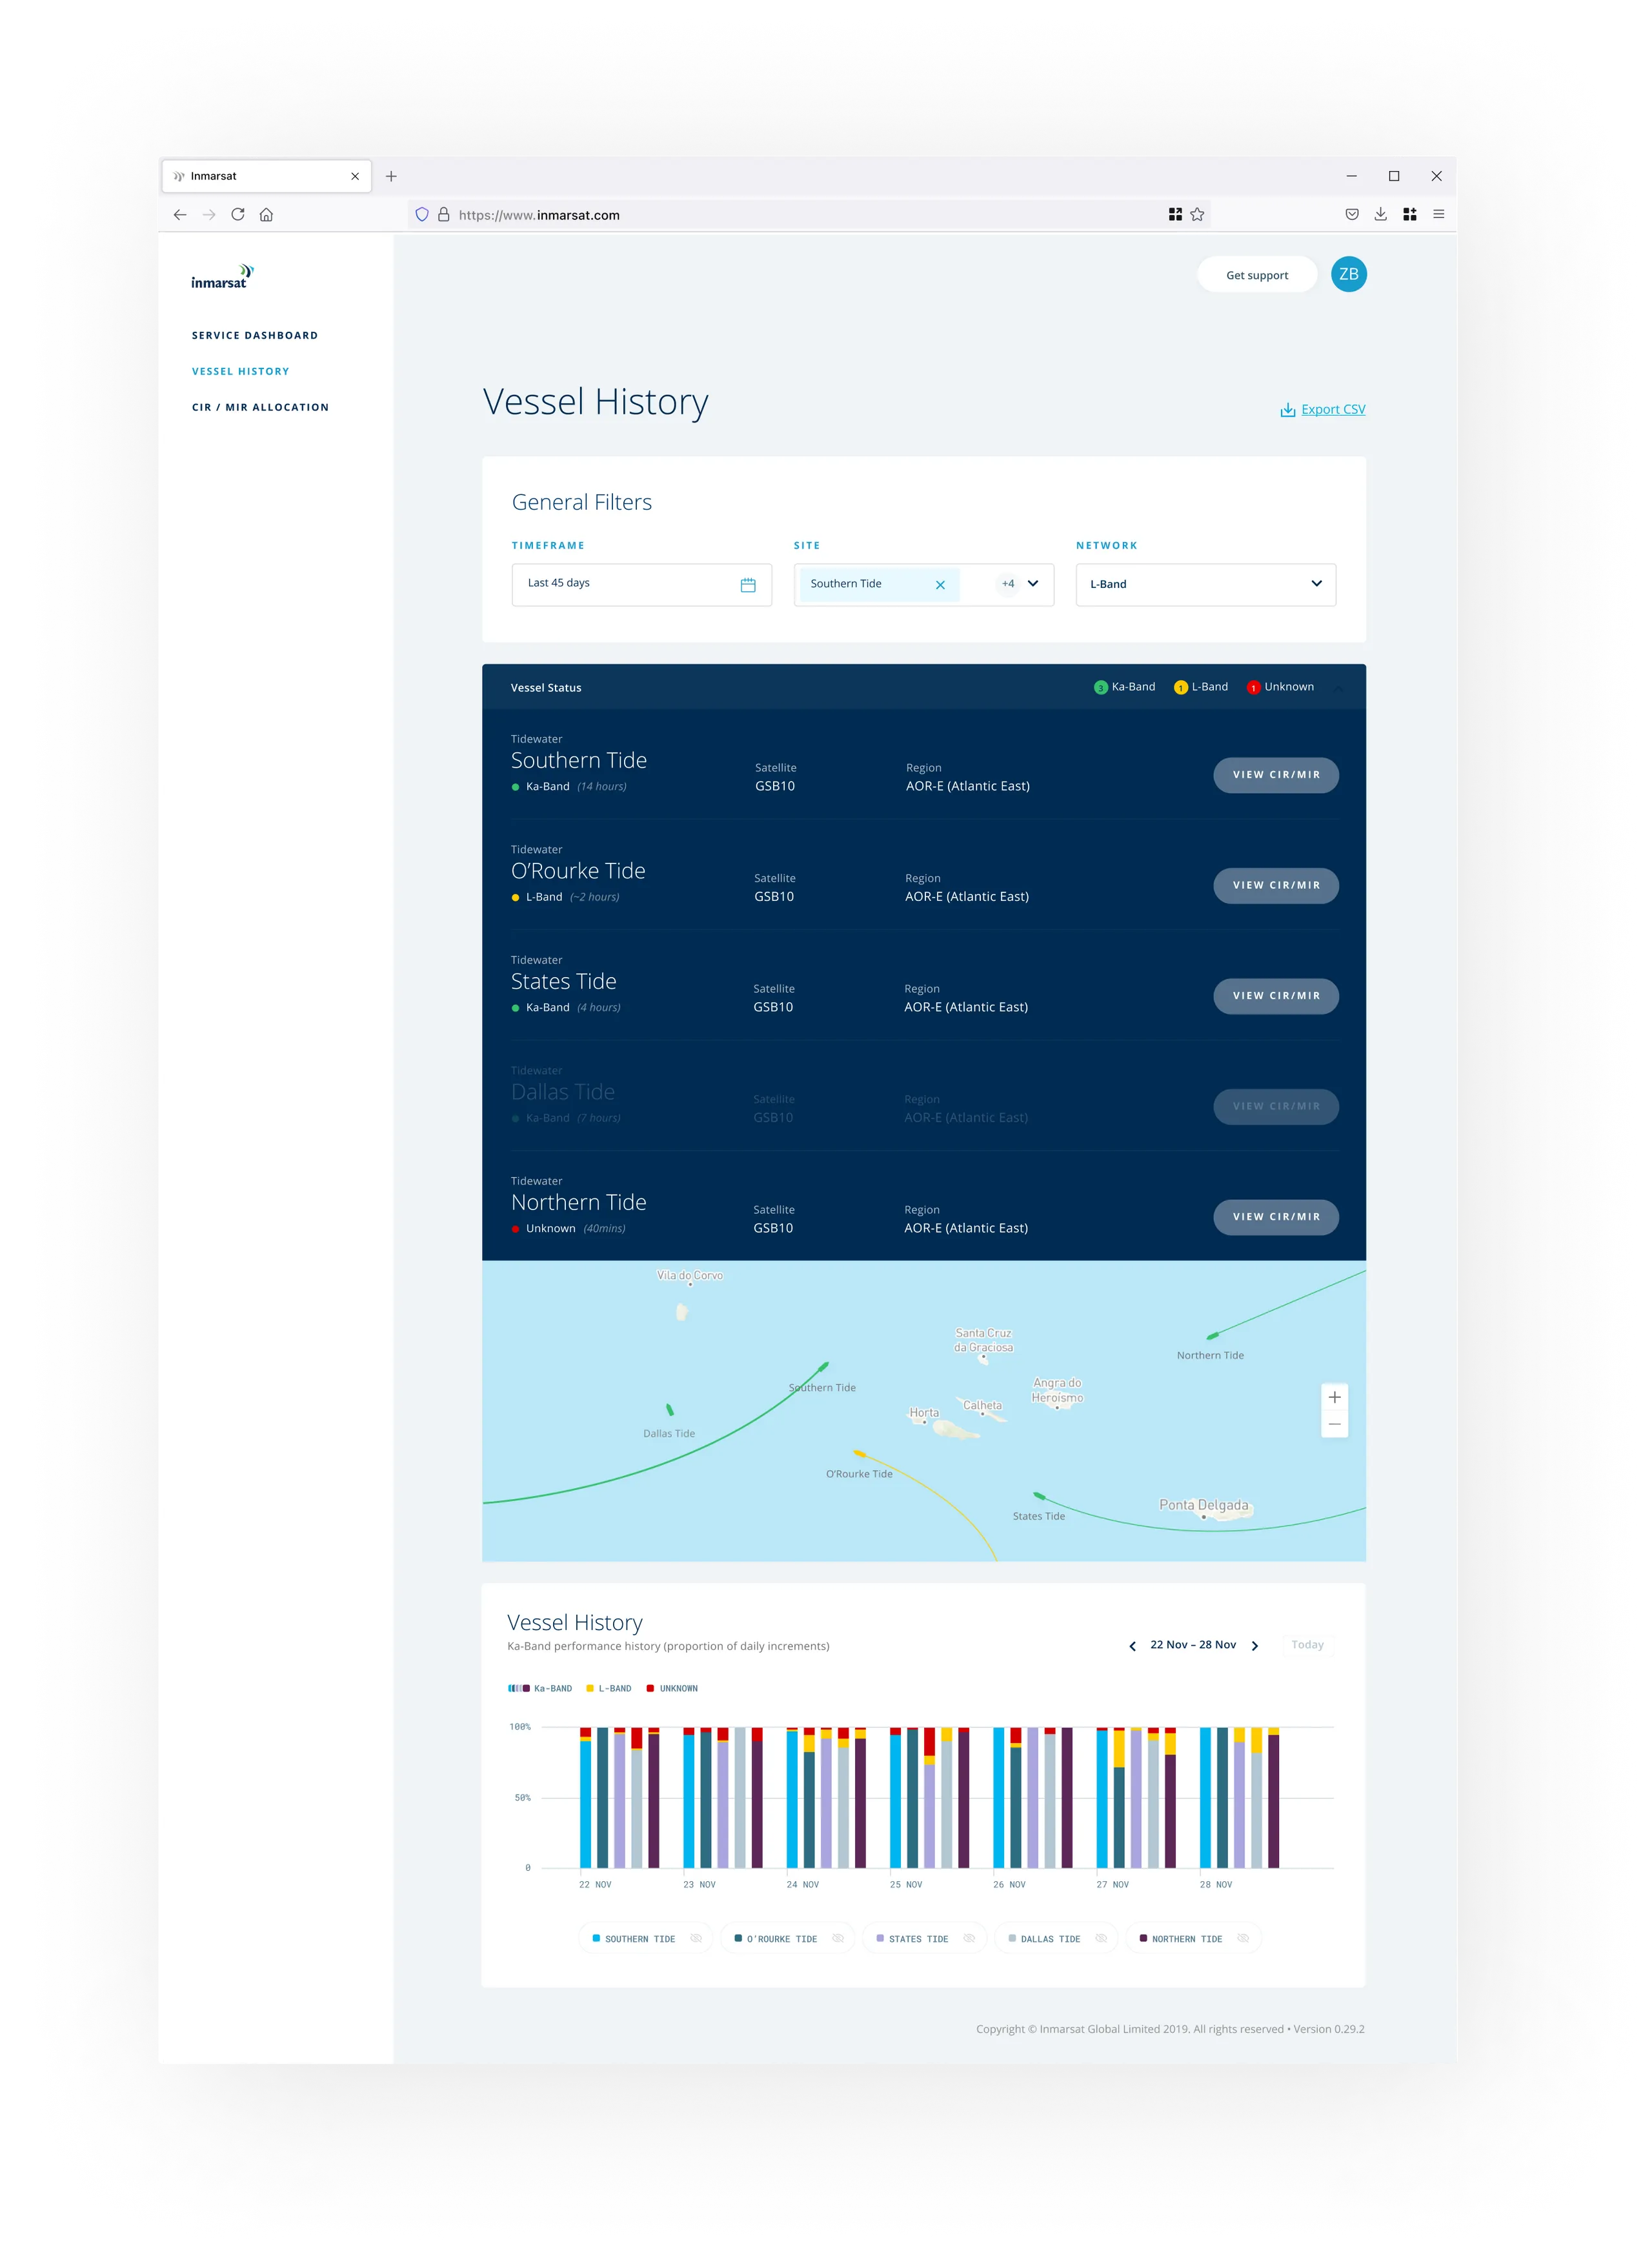
At the core of GXA Assurance is a dashboard allowing customers to determine at a glance the status of their vessels and their connectivity, as well as how those changed over time, in other words:
An overview with all vessels listed along with their status
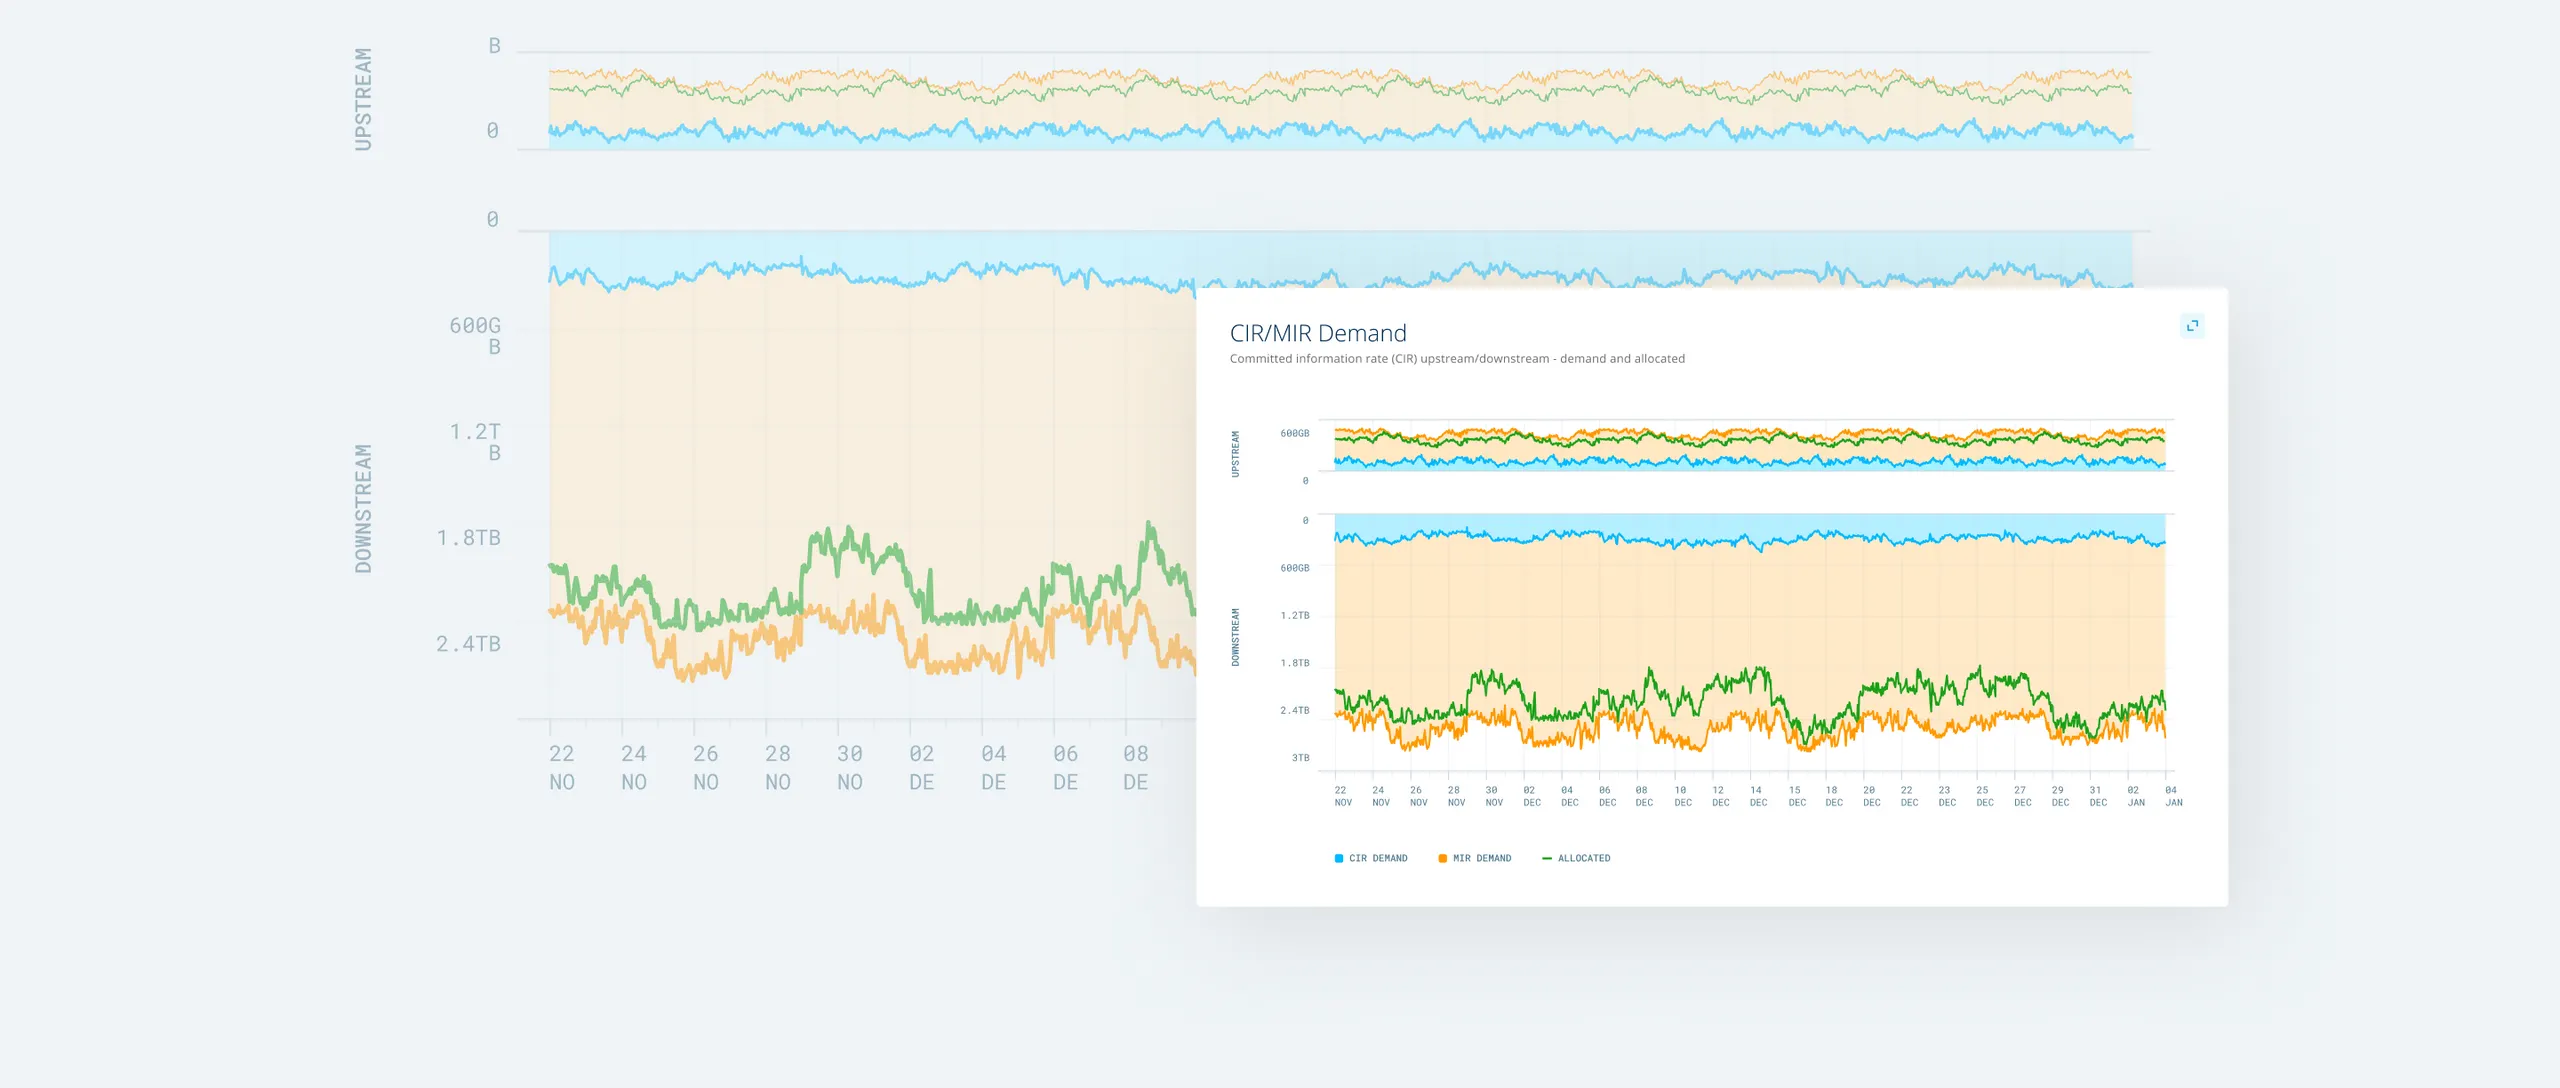
The CIR/MIR
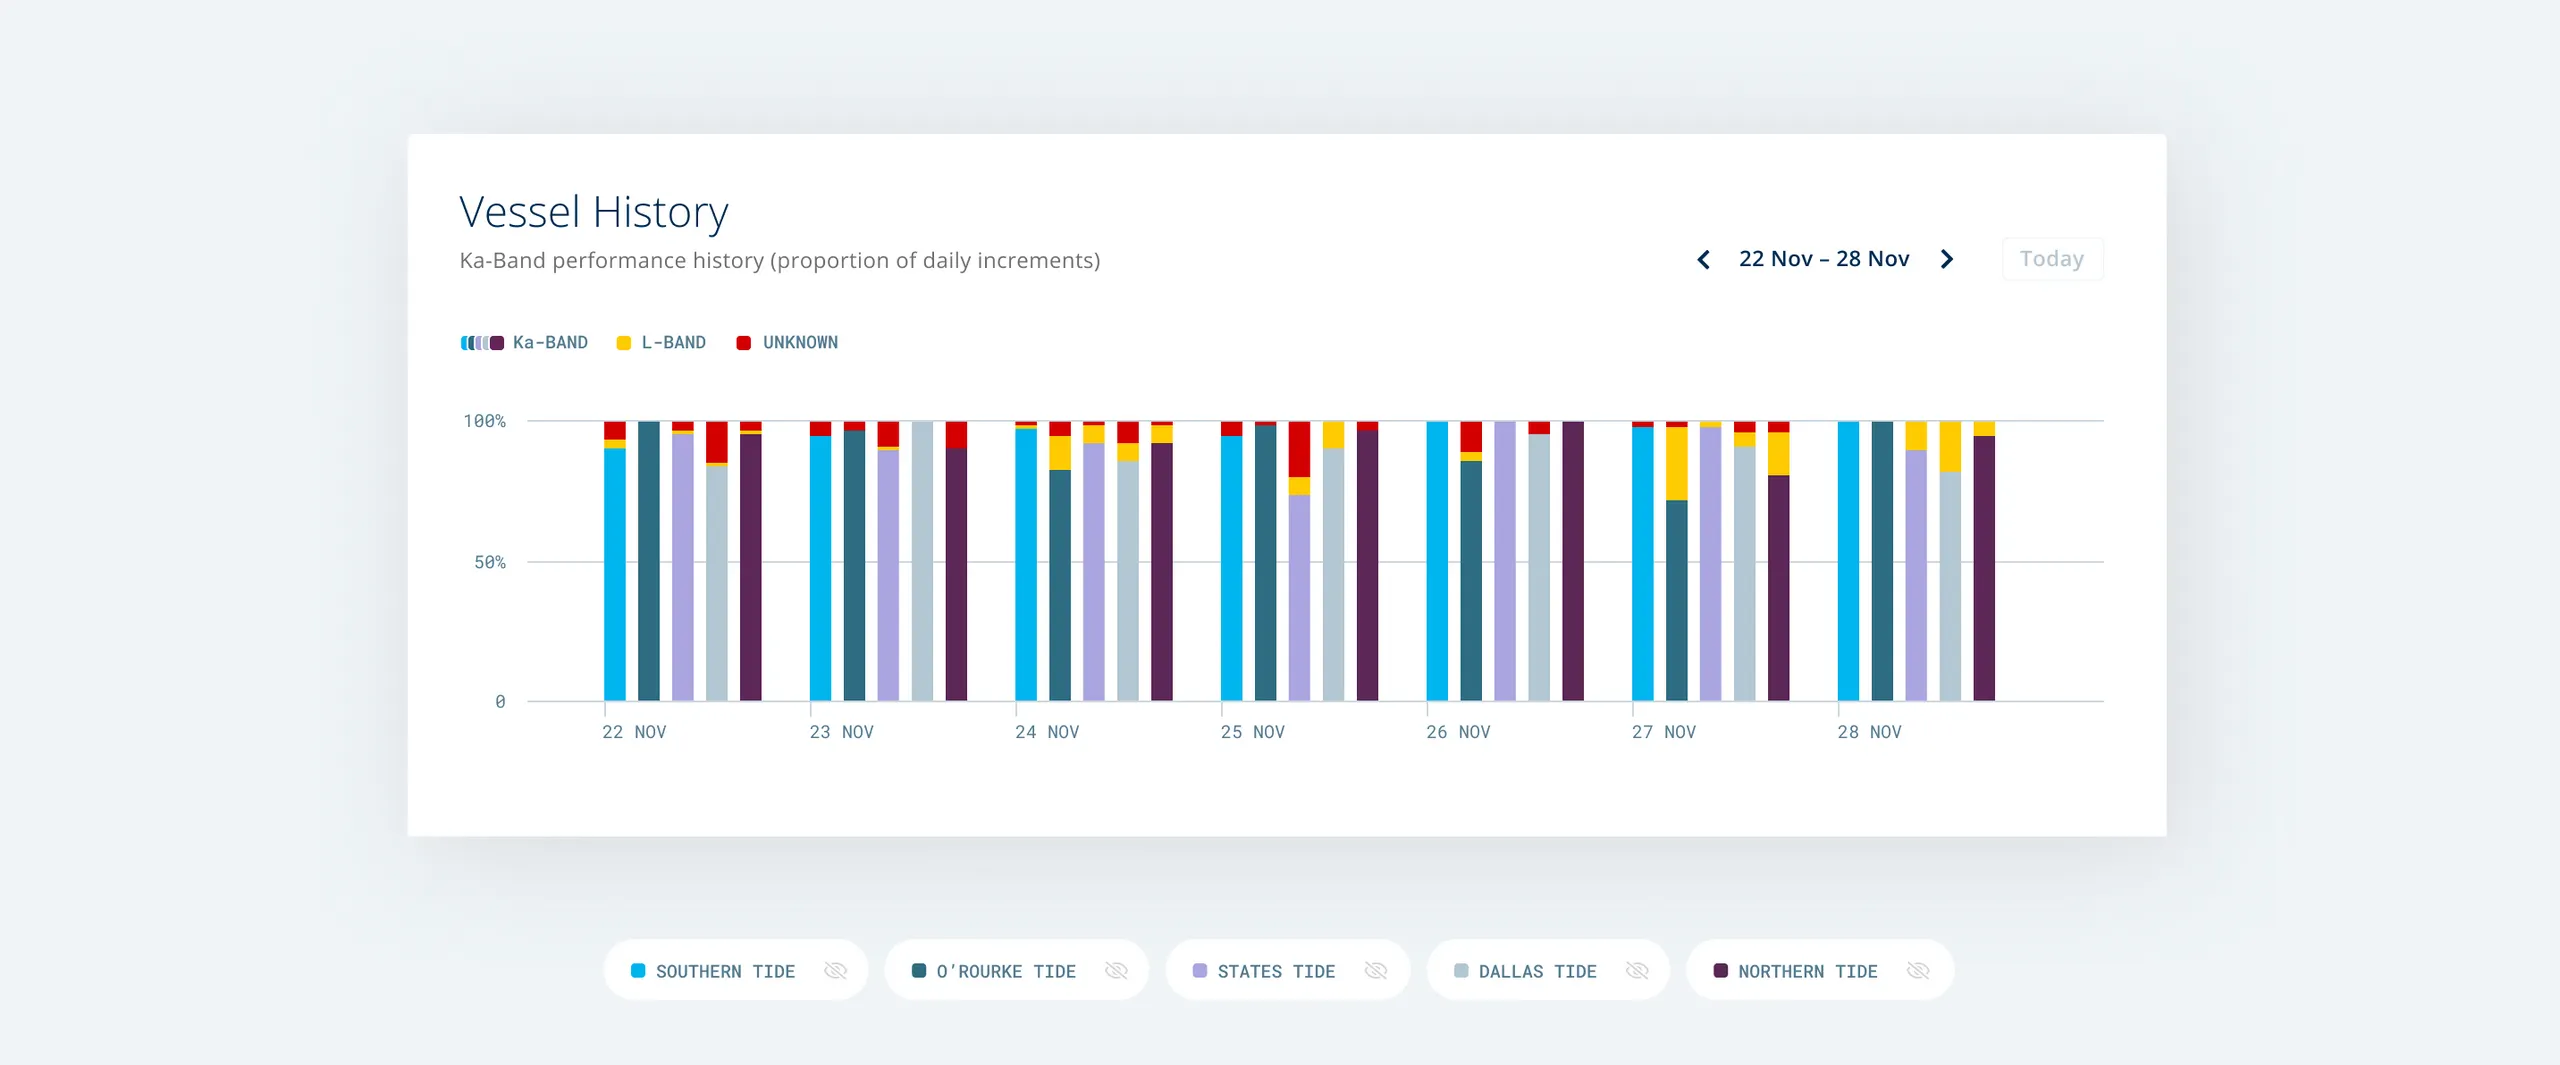
The vessels’ history within different timeframes
A map with all of the vessels’ position visualised
The close alignment of design and engineering on this project meant that designs could be elegant, match the brief in terms of functionality, and function smoothly as they are built following robust engineering principles.
The client was delighted with the outcome - a beautiful UI where you can see on the map the position of any given vessel at any one time.
- Our engineering approach
- Turning internal tools into full products
While GXA Assurance was built on Inmarsat’s existing codebase, there were some specific technologies we needed to introduce due to the nature of the project.
On the backend, we would need to create logic to elegantly and rapidly translate the raw coordinate and status data from the API endpoint so it could be presented in the UI.
On the frontend, the base framework for the project was Angular, which Inmarsat employs across the board, but we would need to decide on some additional frameworks on top to display the data in the UI:
For the maps we customised libraries from LeafletJS - adding some additional elements as required by the specs.
We used NGRX for state management
For the charts we used both ChartJS and EntD3.
As mentioned, we approach the engineering effort from the standpoint of creating a framework that could be easily expanded upon - turning a purpose-built solution into a new standalone product Inmarsat could bring to market with minimal additional work.
- The Result
- Our work with Inmarsat
We looked at the whole journey from the customer’s perspective and reinvented it
Luke Broome Senior DirectorIT Strategy, Data and Automation, Inmarsat

